JavaFX PieChart Tutorial with Examples
1. JavaFX PieChart
No ADS
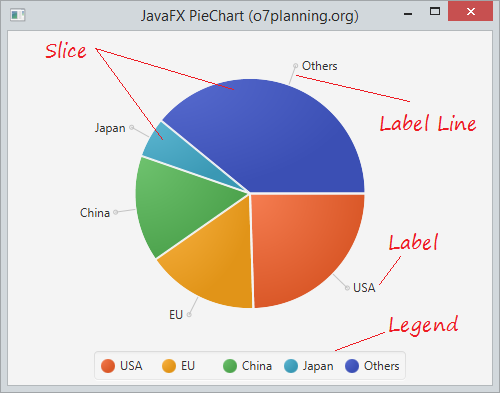
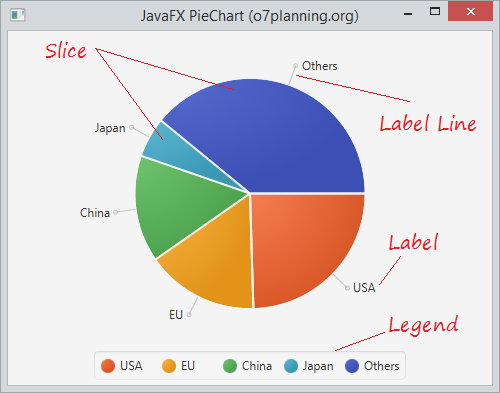
JavaFX PieChart describes a chart that represents data in a form of circle divided into triangular wedges called slices. Each slice represents a percentage that corresponds to a particular value.
GDP data for some countries in 2015:
Country | GDP (Million dollars) |
USA | 17.947.195 |
EU | 11.540.278 |
China | 10.982.829 |
Japan | 4.116.242 |
Others | 28.584.442 |
2. PieChart example
The example below is the PieChart describing GDP of some coutries in 2015.
PieChartDemo.java
package org.o7planning.javafx.piechart;

import javafx.application.Application;
import javafx.geometry.Side;
import javafx.scene.Scene;
import javafx.scene.chart.PieChart;
import javafx.scene.layout.StackPane;
import javafx.stage.Stage;

public class PieChartDemo extends Application {

   @Override
   public void start(Stage primaryStage) throws Exception {

       PieChart pieChart = new PieChart();

       PieChart.Data slice1 = new PieChart.Data("USA", 17947195);
       PieChart.Data slice2 = new PieChart.Data("EU", 11540278);
       PieChart.Data slice3 = new PieChart.Data("China", 10982829);
       PieChart.Data slice4 = new PieChart.Data("Japan", 4116242);
       PieChart.Data slice5 = new PieChart.Data("Others", 28584442);

       pieChart.getData().add(slice1);
       pieChart.getData().add(slice2);
       pieChart.getData().add(slice3);
       pieChart.getData().add(slice4);
       pieChart.getData().add(slice5);

       pieChart.setLegendSide(Side.LEFT);

       primaryStage.setTitle("JavaFX PieChart (o7planning.org)");
       StackPane root = new StackPane(pieChart);

       Scene scene = new Scene(root, 400, 200);

       primaryStage.setScene(scene);

       primaryStage.show();
   }

   public static void main(String[] args) {
       Application.launch(args);
   }
}
3. Custom PieChart
No ADS
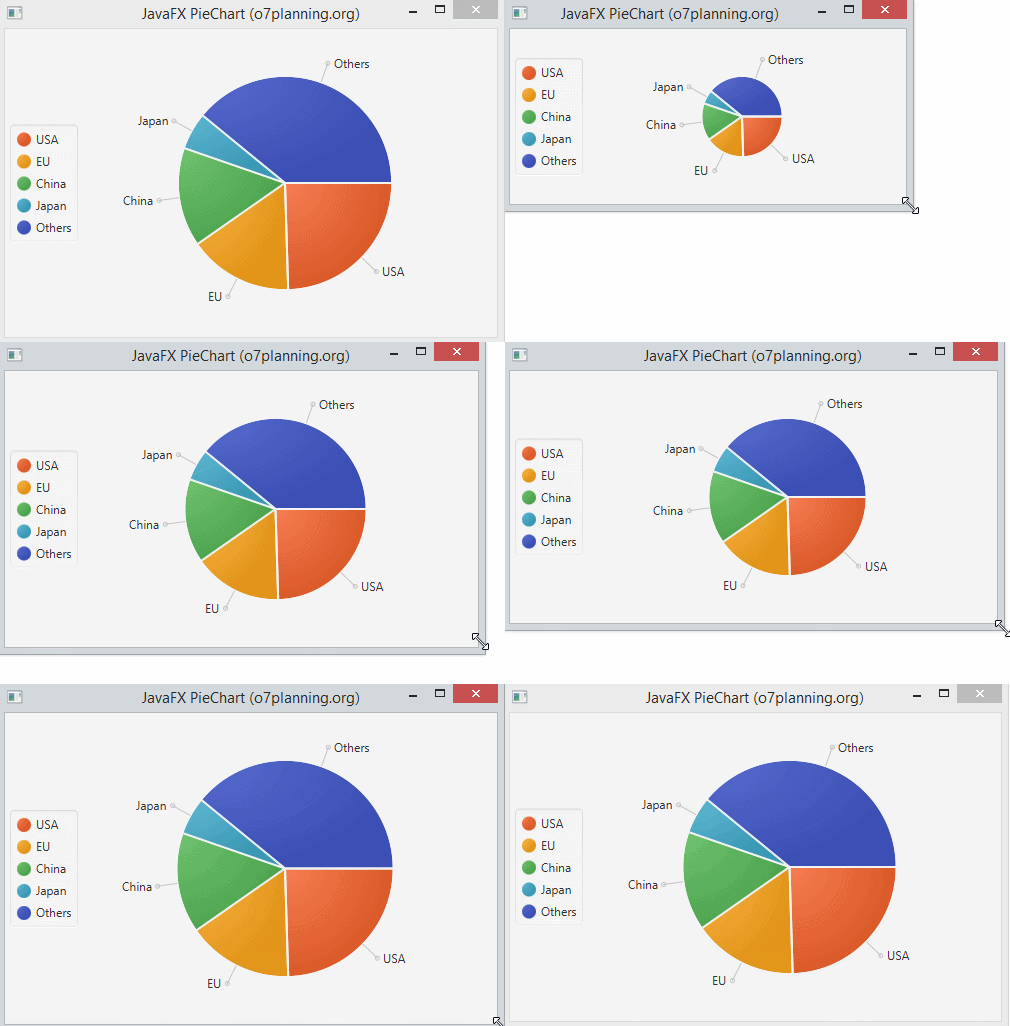
By default PieChart to full display its components, including Labels, and Legend. You can set up the components to display or not display by setLabelsVisile, setLegendVisible methods.
pieChart.setLabelsVisile(false);
pieChart.setLegendVisible(false);
Set up the Lgend display position and and length of Label Line.
chart.setLabelLineLength(10);
chart.setLegendSide(Side.LEFT);
By default, the slices are set up according to clockwise direction. However, you also can set them up in reverse direction using setClockwise(false) method.
Along clockwise:
Counterclockwise:
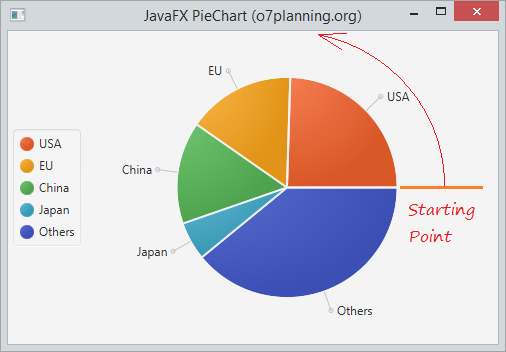
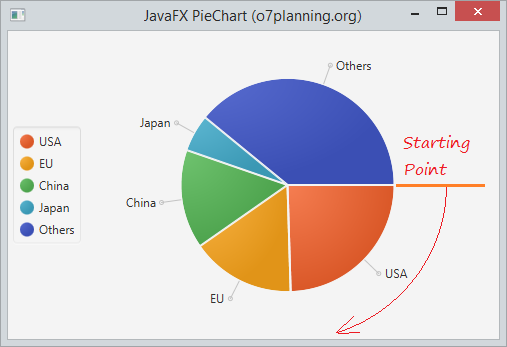
You also can change the starting angle of PieChart via setStartAngle method.
pieChart.setStartAngle(30);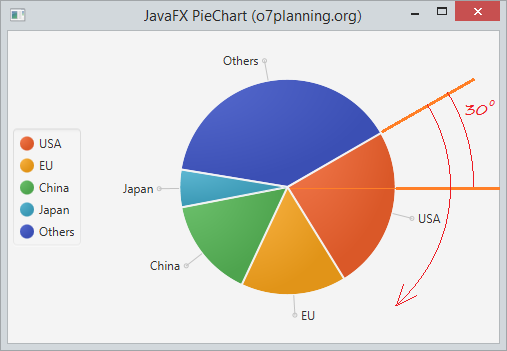
4. PieChart and events
Although a pie chart slice is not a Node object, each PieChart.Data element has a node associated with it, which can be used to analyze events and process them accordingly
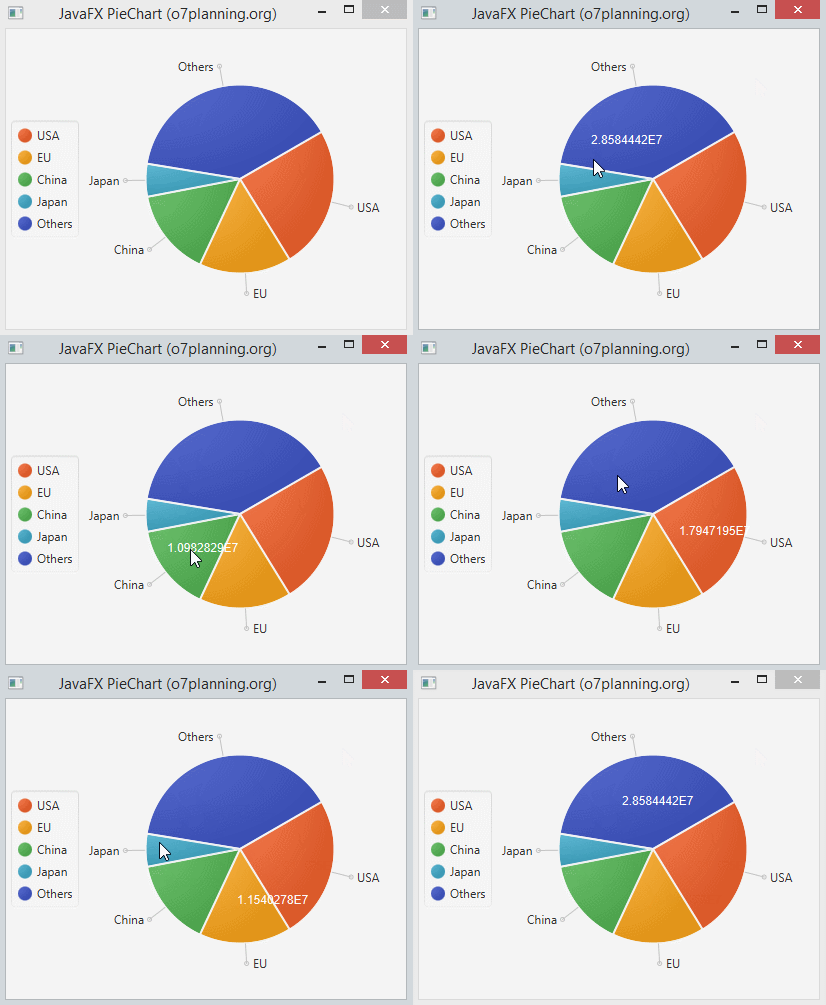
PieChartEventDemo.java
package org.o7planning.javafx.piechart;

import javafx.application.Application;
import javafx.event.EventHandler;
import javafx.geometry.Side;
import javafx.scene.Scene;
import javafx.scene.chart.PieChart;
import javafx.scene.control.Label;
import javafx.scene.input.MouseEvent;
import javafx.scene.layout.AnchorPane;
import javafx.scene.paint.Color;
import javafx.stage.Stage;

public class PieChartEventDemo extends Application {

    @Override
    public void start(Stage primaryStage) throws Exception {

        PieChart pieChart = new PieChart();

        PieChart.Data slice1 = new PieChart.Data("USA", 17947195);
        PieChart.Data slice2 = new PieChart.Data("EU", 11540278);
        PieChart.Data slice3 = new PieChart.Data("China", 10982829);
        PieChart.Data slice4 = new PieChart.Data("Japan", 4116242);
        PieChart.Data slice5 = new PieChart.Data("Others", 28584442);

        pieChart.getData().add(slice1);
        pieChart.getData().add(slice2);
        pieChart.getData().add(slice3);
        pieChart.getData().add(slice4);
        pieChart.getData().add(slice5);

        pieChart.setPrefSize(400, 300);

        pieChart.setLegendSide(Side.LEFT);
        pieChart.setStartAngle(30);

        final Label caption = new Label("");
        caption.setTextFill(Color.WHITE);
        caption.setStyle("-fx-font: 12 arial;");

        for (final PieChart.Data data : pieChart.getData()) {
            data.getNode().addEventHandler(MouseEvent.MOUSE_PRESSED, new EventHandler<MouseEvent>() {
                @Override
                public void handle(MouseEvent e) {
                    caption.setTranslateX(e.getSceneX());
                    caption.setTranslateY(e.getSceneY());

                    caption.setText(String.valueOf(data.getPieValue()));
                }
            });
        }

        primaryStage.setTitle("JavaFX PieChart (o7planning.org)");
        AnchorPane root = new AnchorPane();
        root.getChildren().addAll(pieChart, caption);


        Scene scene = new Scene(root, 400, 300);

        primaryStage.setScene(scene);

        primaryStage.show();
    }

    public static void main(String[] args) {
        Application.launch(args);
    }
}
No ADS
JavaFX Tutorials
- Open a new Window in JavaFX
- JavaFX ChoiceDialog Tutorial with Examples
- JavaFX Alert Dialogs Tutorial with Examples
- JavaFX TextInputDialog Tutorial with Examples
- Install e(fx)clipse for Eclipse (JavaFX Tooling)
- Install JavaFX Scene Builder for Eclipse
- JavaFX Tutorial for Beginners - Hello JavaFX
- JavaFX FlowPane Layout Tutorial with Examples
- JavaFX TilePane Layout Tutorial with Examples
- JavaFX HBox, VBox Layout Tutorial with Examples
- JavaFX BorderPane Layout Tutorial with Examples
- JavaFX AnchorPane Layout Tutorial with Examples
- JavaFX TitledPane Tutorial with Examples
- JavaFX Accordion Tutorial with Examples
- JavaFX ListView Tutorial with Examples
- JavaFX Group Tutorial with Examples
- JavaFX ComboBox Tutorial with Examples
- JavaFX Transformations Tutorial with Examples
- JavaFX Effects Tutorial with Examples
- JavaFX GridPane Layout Tutorial with Examples
- JavaFX StackPane Layout Tutorial with Examples
- JavaFX ScrollPane Tutorial with Examples
- JavaFX WebView and WebEngine Tutorial with Examples
- JavaFX HTMLEditor Tutorial with Examples
- JavaFX TableView Tutorial with Examples
- JavaFX TreeView Tutorial with Examples
- JavaFX TreeTableView Tutorial with Examples
- JavaFX Menu Tutorial with Examples
- JavaFX ContextMenu Tutorial with Examples
- JavaFX Image and ImageView Tutorial with Examples
- JavaFX Label Tutorial with Examples
- JavaFX Hyperlink Tutorial with Examples
- JavaFX Button Tutorial with Examples
- JavaFX ToggleButton Tutorial with Examples
- JavaFX RadioButton Tutorial with Examples
- JavaFX MenuButton and SplitMenuButton Tutorial with Examples
- JavaFX TextField Tutorial with Examples
- JavaFX PasswordField Tutorial with Examples
- JavaFX TextArea Tutorial with Examples
- JavaFX Slider Tutorial with Examples
- JavaFX Spinner Tutorial with Examples
- JavaFX ProgressBar and ProgressIndicator Tutorial with Examples
- JavaFX ChoiceBox Tutorial with Examples
- JavaFX Tooltip Tutorial with Examples
- JavaFX DatePicker Tutorial with Examples
- JavaFX ColorPicker Tutorial with Examples
- JavaFX FileChooser and DirectoryChooser Tutorial with Examples
- JavaFX PieChart Tutorial with Examples
- JavaFX AreaChart and StackedAreaChart Tutorial with Examples
- JavaFX BarChart and StackedBarChart Tutorial with Examples
- JavaFX Line Tutorial with Examples
- JavaFX Rectangle and Ellipse Tutorial with Examples
Show More