FlutterArtist Debug Network Inspector
1. Debug Network Inspector
FlutterArtist uses the flutter_artist_dio library package as a tool to exchange information between the Flutter application and the backend. Essentially, flutter_artist_dio is just a wrapper for the DIO library package; it uses DIO to send and receive data, and logs errors if any occur. Additionally, flutter_artist_dio provides a visual Debug Network Inspector tool to review that log and perform advanced analysis.
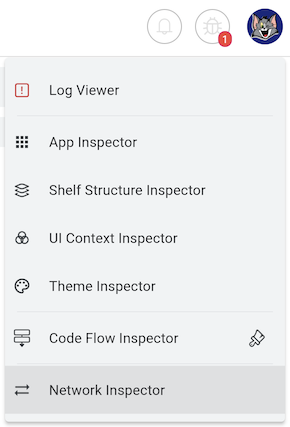
On the FlutterArtist DEMO app, you can find the activation button for the Debug Network Inspector in the top-right corner after logging in as a system user.
ILoggedInUser
interface class ILoggedInUser {

  bool get isSystemUser {
    throw UnimplementedError();
  }
  ...
}
No ADS
If you're writing an application based on the FlutterArtist platform, using code to display the Debug Network Inspector is very simple:
ILoggedInUser? loggedInUser = FlutterArtist.loggedInUser;
bool isSystemUser = loggedInUser?.isSystemUser ?? false;

if(isSystemUser) {
  FlutterArtist.showDebugNetworkInspector(context);
}
Note that since FlutterArtist DIO is designed independently, don't forget to integrate it with FlutterArtist in your AppConfig.
If you are using flutter_artist_dio in a standalone project, unrelated to the flutter_artist package, you can open the Debug Network Inspector using the code below:
await DebugNetworkInspectorDialog.show(
  context,
  showJson: true,
  showToken: true,
);
2. Features of Network Inspector
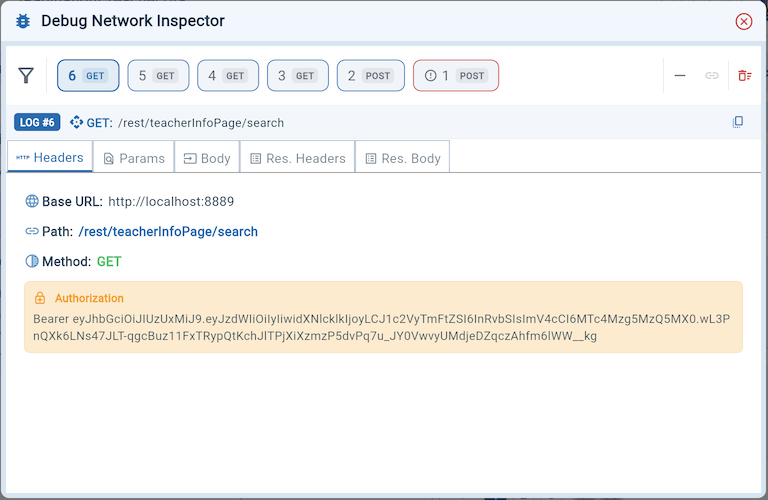
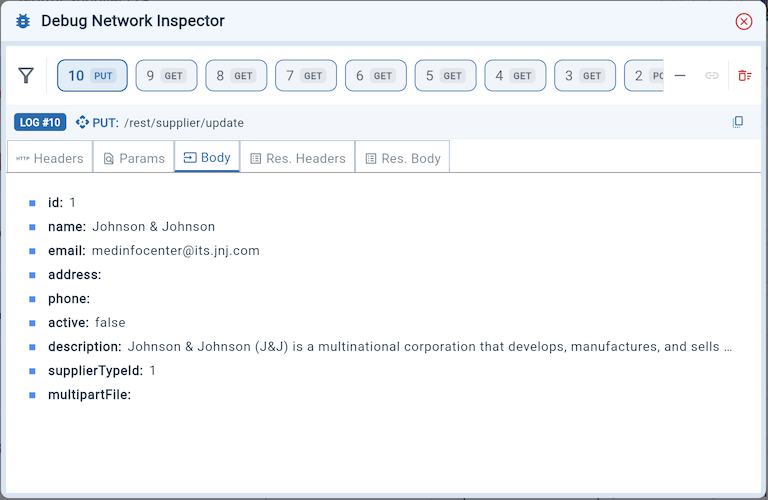
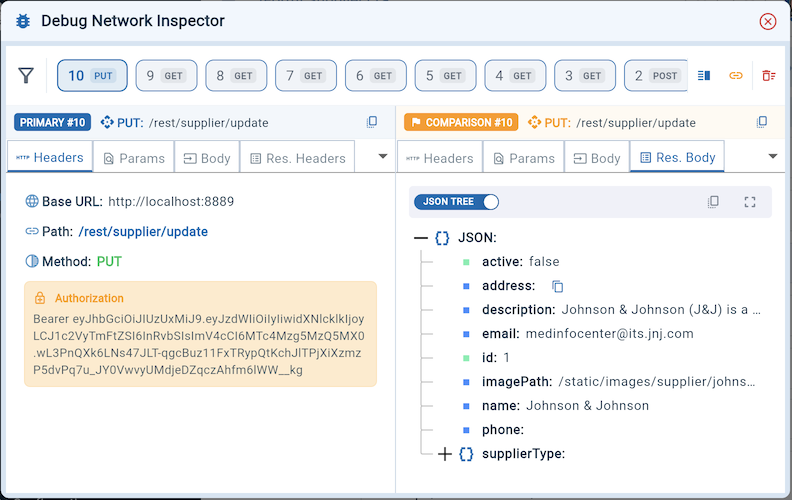
Debug Network Inspector organizes data in an intuitive list, allowing you to select and "dissect" each request via a Tab system:
Request Headers
Manage all identification and outgoing configurations.
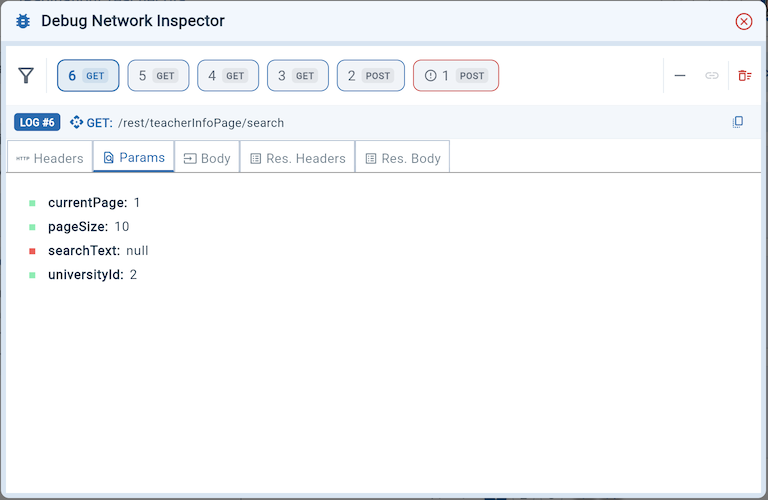
Request Parameters
Quickly view the request's Query Parameters.
Request Body
Display the exact raw data or JSON sent to the Server
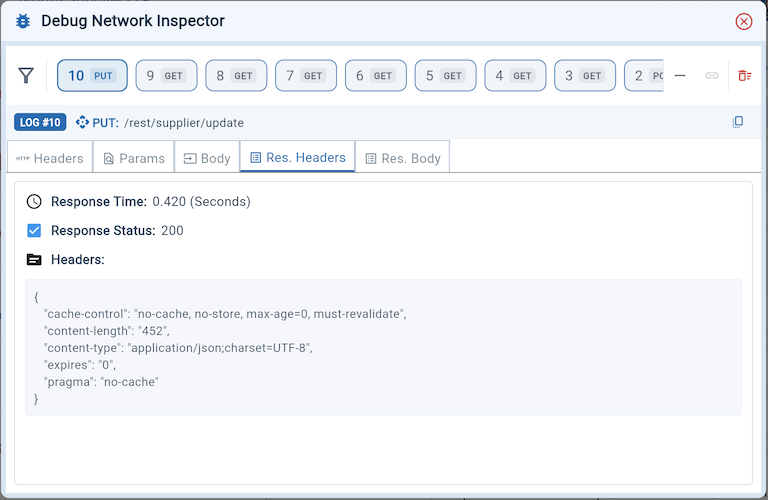
Response Headers:
Provides key metrics like Response Time, Status Code, and error details.
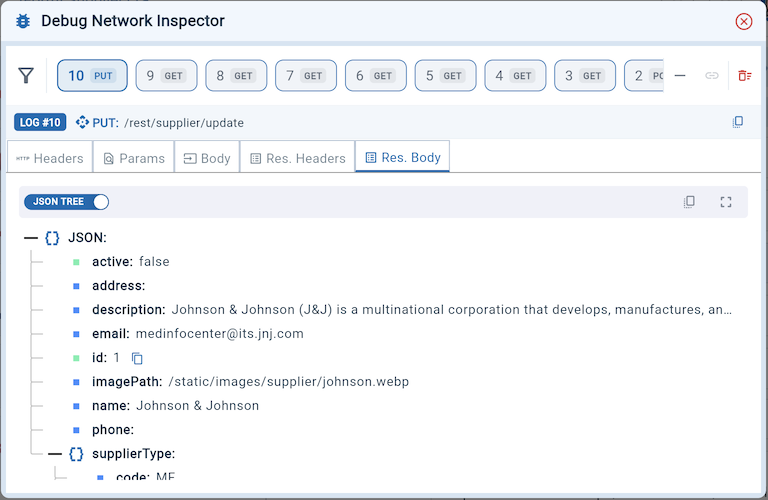
Response Body:
Display response data in Tree View or Plain Text format
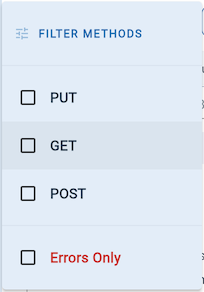
Advanced Filtering
The system provides multi-condition filtering, allowing you to filter by method (GET, POST,...) or focus solely on failed requests (Errors Only).
Split Mode & Sync Mode
This unique feature helps you compare two log records simultaneously on one screen:
- Split Mode: Split the screen left-right to put two requests on the "scale".
- Sync Mode: When activated, two windows are locked together to cross-check the Request - Response of the same log ID.
No ADS
FlutterArtist
- FlutterArtist Debug Network Inspector
- Basic concepts in Flutter Artist
- FlutterArtist Block ex1
- FlutterArtist Filter Example
- FlutterArtist FilterModel MultiOptFilterCriterion ex1
- FlutterArtist FilterInput Example 1
- FlutterArtist Form ex1
- The idea of designing filter models in FlutterArtist
- FlutterArtist FormModel.patchFormFields() Ex1
- FlutterArtist BlockQuickItemUpdateAction Example
- FlutterArtist BlockNumberPagination Ex1
- FlutterArtist GridView Infinite Scroll Example
- FlutterArtist BlockBackendAction Create Multi Items (Example)
- FlutterArtist ListView Infinite Scroll Pagination Example
- FlutterArtist Pagination
- FlutterArtist Sort DropdownSortPanel Example
- FlutterArtist Dio
- FlutterArtist BlockBackendAction Example
- FlutterArtist BackgroundWebDownloadAction Example
- FlutterArtist StorageBackendAction ex1
- FlutterArtist Block External Shelf Event Example
- FlutterArtist Filter FormBuilderMultiDropDown Ex1
- FlutterArtist Master-detail Blocks ex1
- FlutterArtist Scalar ex1
- FlutterArtist Pagination Davi table Infinite Scroll Ex1
- FlutterArtist Filter Tree FormBuilderField ex1
- FlutterArtist Filter FormBuilderRadioGroup ex1
- FlutterArtist Form Parent-child MultiOptFormProp ex1
- FlutterArtist Manual Sorting ReorderableGridView Example
- FlutterArtist Manual Sorting ReorderableListView
- FlutterArtist Scalar External Shelf Event Example
- FlutterArtist Code Flow Inspector
- FlutterArtist Projections
- FlutterArtist Debug Log Viewer
- FlutterArtist start
- FlutterArtist AppConfiguration
- FlutterArtist Debug App Inspector
- FlutterArtist Debug Filter Criteria Inspector
- FlutterArtist Debug Filter Model Inspector
- FlutterArtist Debug Form Model Inspector
- FlutterArtist DebugMenu
- FlutterArtist Debug UI Context Inspector
- FlutterArtist Debug Shelf Structure Inspector
- FlutterArtist Context Provider Views
- FlutterArtist FilterModelStructure ex1
- FlutterArtist FilterModelStructure ex2
- FlutterArtist FilterModelStructure ex3
- FlutterArtist Internal Shelf Event ex1
- FlutterArtist Deferring External Shelf Events Example
- FlutterArtist Face
- Overview of FlutterArtist Theme
- FlutterArtist Theme Design Tokens Architecture
- FlutterArtist Themes FaColorUtils
- Flutter Artist Theme - Create a custom theme
Show More